Surface Roughness can make or break a stainless steel part—like serving a five‑star steak on a paper plate. It’s the detail buyers feel before they ever pull out calipers. Too rough, and seals fail. Too slick, and coatings won’t cling. In high‑volume CNC work, that microscopic texture decides performance, price, and reputation.
Grand View Research reports the global stainless steel market surpassed $130 billion in 2023, driven by industrial and medical demand.
That means precision isn’t picky—it’s profitable. Get the finish right, and everything clicks. Get it wrong, and the headaches stack up fast.
Quick Insights: Surface Roughness Unveiled
➔ Mirror vs Brushed vs Blasted vs Electropolished: balance shine, texture, and corrosion resistance.
➔ Ra, Rz, Rt, Rq explained: choose the right metric for sealing, wear, or cosmetic needs.
➔ CNC secrets: rigid tooling, optimized feeds/speeds, and coolant for uniform finishes.
➔ Budget metrology: use test blocks, dial gauges, or apps for quick roughness checks.
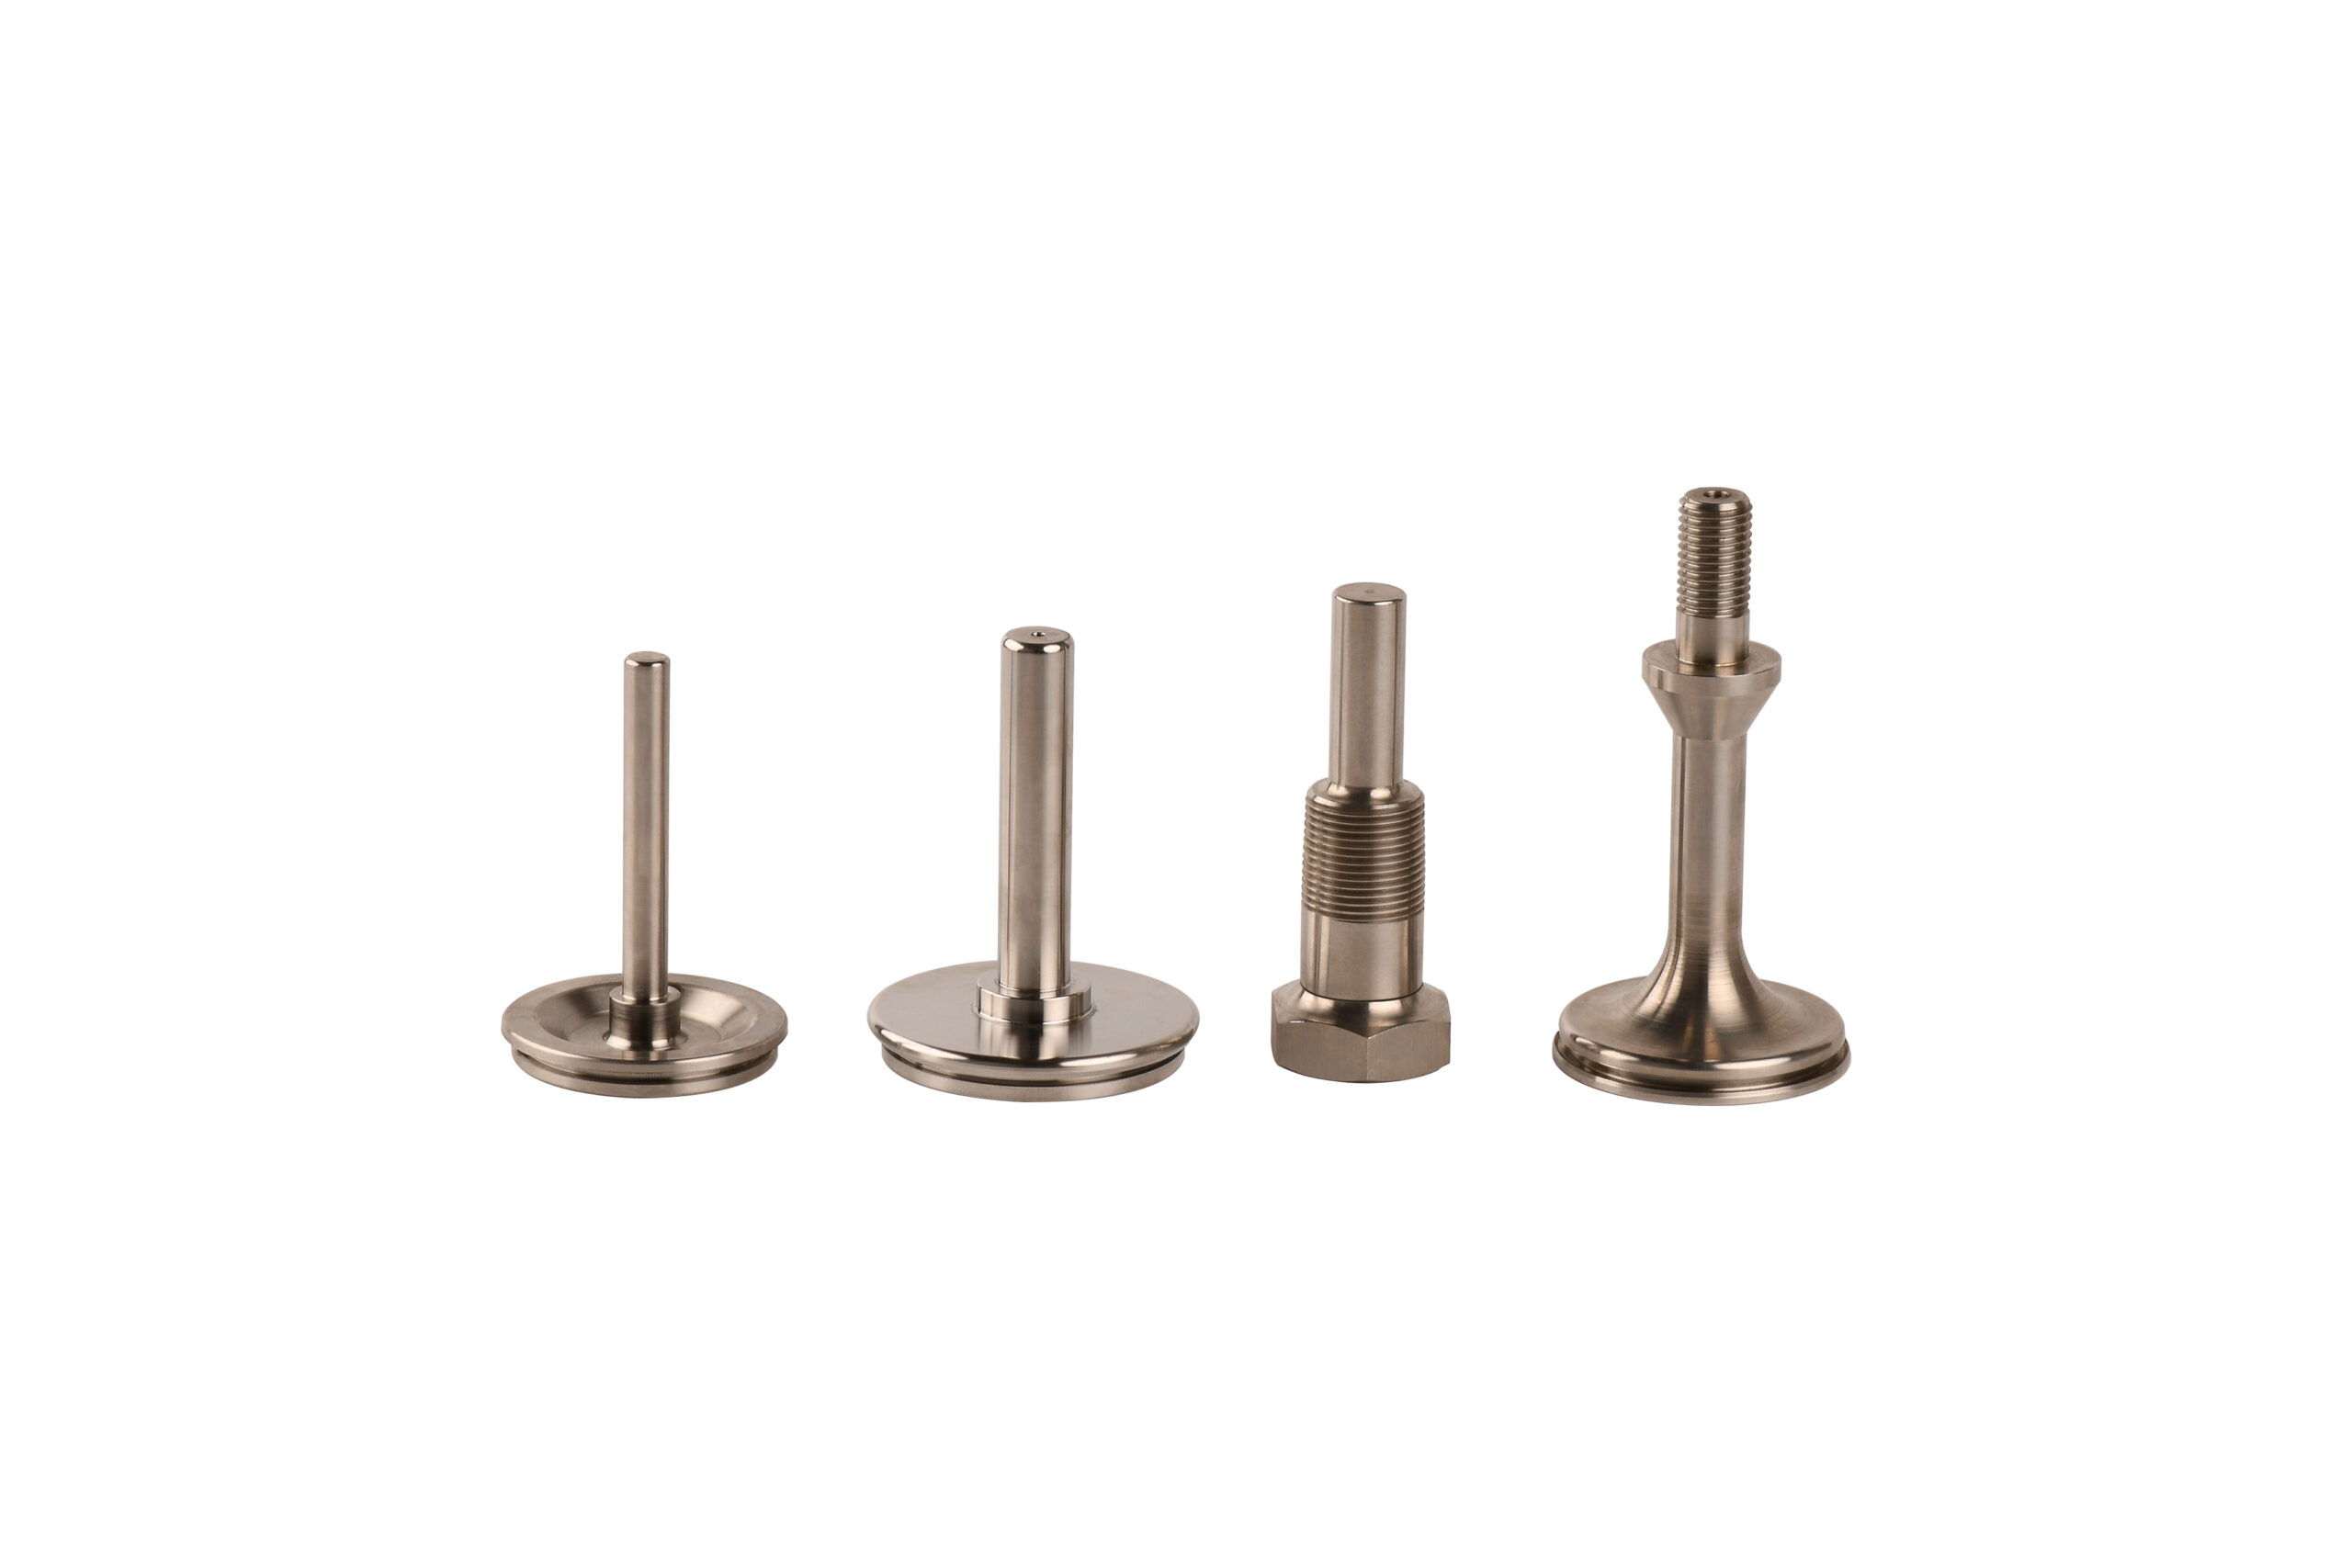
Types Of Stainless Steel Finishes Explained
Surface quality isn’t just about looks; it’s about performance. When we talk about Surface Roughness, we’re really breaking it into two simple ideas: surface condition and roughness level. From visual shine to measurable Ra values, every finish shifts corrosion behavior, cleanability, and feel. Let’s unpack how each option balances surface texture, durability, and real-world practicality.
Mirror Polished Finish
This finish targets ultra-low Surface Roughness through staged mechanical refinement.
- Performance Core
- Surface Characteristics
- Extremely smooth surface
- High mirror-like quality
- Strong optical clarity
- Measured Control
- Reduced Ra value
- Minimal surface texture variation
- Surface Characteristics
- Functional Advantages
- Enhanced corrosion resistance
- Easy cleaning due to low surface roughness
- Premium glossy appearance
- Best Fit Applications
- Decorative panels
- Visible hardware
- High-end consumer products
At yuuhuan hongqian, polishing lines are tuned to stabilize Surface Roughness so the final surface finish roughness stays consistent across batches.
Brushed (Satin) Finish
This style manages Surface Roughness differently by introducing controlled abrasion.
- Texture Design
- Linear abrasive action
- Clear directional grain
- Balanced uniform texture
- Visual Effect
- Soft matte appearance
- Gentle subtle sheen
- Linear abrasive action
- Practical Gains
- Improved scratch resistance
- Strong fingerprint resistance
- Reduced glare with a non-reflective look
The result? A surface that feels refined but not flashy. The roughness level is moderate, giving grip without harshness. yuuhuan hongqian adjusts belt grit to fine-tune surface texture for architectural and appliance uses.
Bead Blasted Finish
Instead of lines, this method creates a non-linear profile.
- Impact Process
- Pressurized media contact
- Non-directional finish
- Even uniform grain
- Visual Tone
- Soft diffused reflection
- Consistent uniform matte
- Pressurized media contact
- Surface Behavior
- Slightly increased Surface Roughness
- Enhanced impact resistance
- Stable appearance across large panels
It feels smooth to the touch, yet the microscopic roughness adds character. That balance makes it popular for industrial housings.
Electropolished Finish
Here, chemistry reshapes the surface at a micro level.
- Electrochemical Action
- Peak removal
- Lowered Surface Roughness
- Reduced surface finish roughness
- Surface Enhancement
- Strengthened passive layer
- Noticeable bright finish
- Peak removal
- Hygiene & Performance
- True ultra-smooth surface
- Easier sterilization
- Lower friction and burr removal
For food and medical components, yuuhuan hongqian relies on this process to push roughness control to tight tolerances. The smoother the surface, the fewer hiding spots for contaminants. Clean, bright, and built to last.
4 Key Parameters That Determine Surface Roughness Quality
Surface Roughness plays a huge role in how parts feel, seal, and last. When we break down Surface and Roughness as two ideas—texture and deviation—the quality story gets clearer. Good surface finish isn’t luck; it’s measured, controlled, and tuned.
Ra (Roughness Average) Value
When engineers talk about Surface Roughness, Ra usually comes up.
- Core meaning
- average roughness based on the arithmetical mean of deviations
- Reflects overall surface texture consistency
- How it works
- A probe tracks every peak and valley along the surface profile.
- Deviations from the mean line are measured under a defined measurement standard.
- The values are averaged to calculate the final profile height result.
- Practical impact
- Easy comparison between parts
- Widely accepted for general finish control
- May hide extreme spikes
For many machining shops, including yuuhuan hongqian, controlling Ra keeps Surface Roughness stable in daily production. It’s the go-to number when customers want clean, reliable surface quality.
Rz (Maximum Height) Measurement
Rz digs deeper into Surface Roughness by focusing on vertical extremes.
- Measurement focus
- Average of highest peaks
- Average of lowest valleys
- True maximum roughness insight
- Functional relevance
- Sealing surfaces
- Wear zones
- Fatigue-prone parts
- Technical breakdown
- Evaluation length divided into sampling segments
- Each segment records peak-to-valley height
- Results averaged across the surface profile
Because Rz reflects material ratio effects, it tells you how roughness influences real contact. For critical assemblies, yuuhuan hongqian often checks both Ra and Rz to keep Surface Roughness aligned with performance goals.
Rt (Total Profile Height)
Rt shows the single largest total profile height across the inspection length. One extreme highest peak and one deep lowest valley define it.
- Detection purpose
- Spot machining errors
- Catch tool chatter marks
- Identify abnormal surface deviation
- Evaluation logic
- Scan full evaluation length.
- Locate maximum excursion.
- Record overall roughness limit.
If Surface Roughness suddenly spikes, Rt exposes the problem fast. It’s blunt but honest.
Rq (Root Mean Square)
Rq applies a root mean square calculation, making it a stronger statistical measure than Ra.
- Mathematical sensitivity
- Squares each deviation from mean line
- Emphasizes sharp surface irregularities
- Analytical value
- Captures true average deviation
- Useful for precision profile analysis
Rq reacts more to extreme peaks. When high-precision Surface Roughness matters—optical seats, tight seals—this metric gives a clearer view of surface finish behavior.
Together, Ra, Rz, Rt, and Rq define Surface Roughness in measurable terms. Control the numbers, and the surface quality follows.
| Parameter | Focus | Practical Use Case |
| Ra (Roughness Average) | Arithmetic mean of all deviations. | General quality reference for most CNC parts. |
| Rz (Maximum Height) | Average of the highest peaks and lowest valleys. | Critical for sealing surfaces and fatigue-prone parts. |
| Rt (Total Profile Height) | The single largest excursion on the profile. | Best for catching tool chatter or machining errors. |
| Rq (Root Mean Square) | Statistical measure sensitive to sharp spikes. | Used in high-precision optical or metrology seats. |
| ISO Grade | Ra (μm) | Ra (μin) | Finish Description | Typical Application |
| N5 | 0.4 | 16 | Fine Ground | High-precision bearings & seals |
| N6 | 0.8 | 32 | Fine Machined | Hydraulic components / O-ring seats |
| N7 | 1.6 | 63 | Smooth Machined | Standard CNC parts / Brackets |
| N8 | 3.2 | 125 | Commercial | General industrial housings |
| N9 | 6.3 | 250 | Rough Machined | Structural supports / Base plates |
Surface Roughness Secrets for CNC Accuracy
High-quality finishes aren’t luck—they are the result of controlled physics.
-
Minimize Tool Deflection: Use solid carbide tools and shrink-fit holders. Reducing runout (target < 0.03 mm) stabilizes Ra values.
-
Optimize Feed & Speed: Lowering the feed per tooth directly reduces the “peak” height of tool marks.
-
Leverage Coolant: High-pressure cooling clears chips before they scratch the fresh surface and prevents the “built-up edge” (BUE) that ruins texture.
Surface Roughness Secrets Revealed: Boost CNC Part Accuracy
Surface Roughness isn’t just a number on a drawing—it’s the difference between silky motion and early wear. When surface and roughness factors drift out of control, part accuracy takes a hit. From Ra to Rz, every micron counts. Dialing in Surface Roughness means balancing force, heat, and motion so the final surface texture stays predictable and clean.
Minimizing Tool Deflection for Consistent Ra
Keeping Surface Roughness stable starts with controlling tool deflection at its root.
- Tooling System Control
- Tool rigidity
- Use solid carbide tools with higher modulus.
- Reduce stick-out to lower bending moments.
- Tool holder
- Prefer hydraulic or shrink-fit holders for better clamping.
- Check runout below 0.005 mm to protect Ra values.
- Vibration damping
- Integrate damped extensions in deep cavities.
- Match holder mass to spindle dynamics.
- Tool rigidity
- Cutting Parameter Balance
- Cutting force
- Lower radial engagement to reduce lateral load.
- Adjust spindle speed to avoid resonance bands.
- Cutting force
- Machine Stability Check
- Inspect spindle bearings.
- Verify fixture torque.
- Confirm axis backlash compensation.
When deflection drops, surface finish improves. Ra stabilizes. Surface roughness stops drifting across long production runs. Shops working with yuuhuan hongqian often notice that better rigidity instantly tightens dimensional spread and smooths the final surface texture.
Optimizing Feed and Speed to Control Rz
Rz reflects peak-to-valley height, so feed and speed choices show up fast on the machined surface.
Key tuning points:
- Feed rate too high? Tool marks deepen.
- Spindle speed too low? Built-up edge forms.
- Depth of cut excessive? Vibration creeps in.
- Start with manufacturer baseline data.
- Increase speed gradually while monitoring surface texture.
- Adjust feed per tooth to balance chip load and finish.
Below is a practical comparison for steel milling:
| Spindle Speed (rpm) | Feed Rate (mm/tooth) | Depth of Cut (mm) | Measured Rz (µm) |
|---|---|---|---|
| 3000 | 0.08 | 0.5 | 18 |
| 4500 | 0.06 | 0.5 | 12 |
| 6000 | 0.05 | 0.3 | 9 |
| 7500 | 0.04 | 0.3 | 7 |
Notice how reducing material removal rate slightly can dramatically improve maximum roughness height. A smoother surface finish doesn’t always mean crawling slow—it means smart balance between tool path, chip load, and heat generation.
Leveraging Coolant for Smoother Surfaces
Dialing in coolant is a practical way to control Surface Roughness and overall surface quality.
Step 1: Select the right coolant type.
Match material to fluid—water-soluble for steel, oil-based for aluminum finishing.
Step 2: Improve lubrication at the cutting edge.
Aim nozzles directly at the shear zone to prevent built-up edge.
Step 3: Enhance chip evacuation.
High-pressure systems clear chips before they scratch the fresh surface.
Step 4: Strengthen thermal management.
Stable temperature keeps tool expansion predictable and protects micro-level surface integrity.
When heat drops, friction drops. The cutting fluid forms a barrier, protecting the new surface. That’s how yuuhuan hongqian maintains consistent Surface Roughness across precision components—controlled cooling, steady chips, and no drama on the final pass.
Can You Measure Finish Without Advanced Metrology?
Surface quality is not always measured with high-end tools. When budgets feel tight, shops still need reliable ways to judge Surface Roughness, surface texture, and surface finish without fancy gear.
Visual Comparison Using Standard Test Blocks
For quick checks on Surface Roughness, many machinists rely on visual inspection and calibrated standard test blocks. It’s old-school, but still useful.
- Core idea
- Compare the part directly against certified roughness standards.
- Match shine, lay pattern, and fingertip drag.
- Use printed comparison charts for added reference.
- How it works in practice
- Clean the part to remove oil or dust.
- Place it beside the standard test blocks under steady lighting.
- Check surface texture visually.
- Lightly move a fingernail across both surfaces to sense differences in surface finish.
- What to watch
- Direction of machining marks
- Consistency of peaks and valleys
- Obvious deviations in surface profile
This method delivers a qualitative assessment, not certified data. Shops focused on consistent Surface Roughness often pair this with process control. Manufacturers like yuuhuan hongqian stress that trained eyes improve repeatability, especially for stable production runs where surface roughness rarely drifts far from target.
Profilometer Alternatives: Dial Gauge Methods
A dial gauge is not built for detailed surface roughness metrics, yet it can reveal variation trends.
- Measurement principle
- A contact measurement tip moves across a surface profile.
- The needle shows relative displacement.
- Peaks and dips become visible as motion changes.
- Practical workflow
- Secure the component firmly.
- Zero the mechanical measurement device.
- Slide across a defined path.
- Record comparative readings.
- Suitable use cases
- Before-and-after polishing checks
- Batch comparison within the same setup
- Detecting abnormal shifts in Surface Roughness
- Limitations
- No Ra value output
- Weak traceability
- Limited compliance with formal basic metrology standards
For shops running stable equipment from yuuhuan hongqian, this approach works as a trend monitor. It won’t replace a profilometer, but it flags when surface finish starts drifting beyond acceptable roughness levels.
Smartphone Apps: A Rough Estimate Only?
Digital tools sound cool, and yes, some smartphone applications claim surface finish estimation using image analysis or vibration signals.
- What these apps attempt
- Capture micro-shadows from machining marks
- Convert pixel contrast into roughness approximation
- Offer instant feedback as digital tools for quick assessment
- Reality check
- Lighting changes distort results.
- Camera resolution limits detail.
- Algorithms lack calibration to real Surface Roughness standards.
- Bottom line
- Handy for screening
- Risky for quality release
- Not suitable for certified engineering decisions
Surface roughness, surface texture, and overall Surface Roughness control still demand controlled measurement when tolerances are tight. For serious production environments, especially those aiming for consistent surface finish across batches, yuuhuan hongqian recommends combining practical shop-floor checks with formal metrology when specs call for it.
Too Smooth Or Too Rough? Find The Ideal Finish
Surface Roughness sounds technical, yet it shapes how parts feel, seal, slide, and survive. Break the term into Surface and Roughness, and it becomes clearer: the condition of a surface and the degree of its texture. Getting Surface Roughness right is not fancy science; it is practical engineering that affects cost, wear, and product life every single day.
Smooth Finish
When Surface Roughness stays low, performance shifts in subtle but powerful ways. A Low Ra Value often signals tighter peaks and valleys, which supports sealing and hygiene.
- Functional Impact
- Sealing performance
- Reduced micro-gaps
- Better fluid containment
- Cleanability
- Favored in food and medical lines
- Sealing performance
- Surface Types
- Polished
- High shine
- Easy wipe-down
- Mirror Finish
- Near-zero visible texture
- Premium Aesthetic Appeal
- Electropolished
- Enhanced Corrosion Resistance
- Polished
- Measured Comparison
| Finish Type | Ra (µm) | Corrosion Resistance (%) |
|---|---|---|
| Mirror Finish | 0.05 | 95 |
| Satin Finish | 0.40 | 88 |
| Standard Machined | 1.60 | 72 |
Lower surface roughness often means higher cost. Still, brands like yuuhuan hongqian balance Surface Roughness control with smart machining, keeping finishes smooth without blowing budgets. Too smooth, though, and lubrication retention drops. Friction may spike.
Rough Finish
Higher Surface Roughness increases texture depth and mechanical grip. That rough surface can be a real asset.
- Functional Strength
- Adhesion boost
- Stronger Paint Adhesion
- Better coating bond
- Friction control
- Oil retention pockets
- Adhesion boost
- Surface Styles
- Brushed
- Directional texture
- Matte Finish
- Soft glare control
- Textured Surface
- Clear Grip Enhancement
- Brushed
- Engineering Effects
- High peaks
- Risk of stress concentration
- High High Ra Value
- Improved Mechanical Interlocking
- Potential wear increase
- High peaks
Surface Roughness must match the job. Excess roughness accelerates abrasion. Controlled roughness improves bonding. yuuhuan hongqian fine-tunes each surface profile so surface texture works with the application, not against it.
FAQs about Surface Roughness
How does Surface Roughness affect CNC part quality?
Surface Roughness shapes how a part feels, fits, and survives in real use.
1) Function fit – Lower Ra values reduce friction and improve sealing contact.
2) Fatigue life – Fewer sharp peaks (controlled Rz) mean less stress concentration.
3) Wear behavior – Rough surfaces wear faster under load.
In precision CNC components, a balanced Surface Roughness keeps accuracy steady while avoiding unnecessary machining cost.
What are the most common stainless steel finishes in CNC manufacturing?
Different finishes serve different visual and functional goals:
- Mirror Polished: Very low Ra, high reflectivity, used for visible or decorative parts.
- Brushed (Satin): Fine linear texture, hides scratches and fingerprints.
- Bead Blasted: Uniform matte look with moderate Surface Roughness.
- Electropolished: Smooth, bright, and highly corrosion-resistant for hygienic industries.
Each option adjusts Surface Roughness to match appearance, cleaning needs, and durability.
Why are Ra and Rz both important in Surface Roughness control?
Surface Roughness is not just one number.
| Parameter | What It Shows | Why It Matters |
|---|---|---|
| Ra | Average roughness | Quick quality reference |
| Rz | Peak-to-valley height | Sealing and wear risk |
Ra gives a general snapshot. Rz exposes sharp highs and deep lows that can cause leaks or early failure. Together, they reveal the real surface condition.
How can Surface Roughness be controlled during machining?
Control happens at the machine, not after production.
- ✓ Adjust feed rate and spindle speed to refine Ra values.
- ✓ Maintain tool rigidity to prevent vibration marks.
- ✓ Use coolant to reduce heat and surface tearing.
- ✓ Inspect samples against roughness standards for consistency.
When these details are managed carefully, Surface Roughness becomes predictable, repeatable, and aligned with part performance goals.